What this study is about
This study is looking at climate impacts on:
- flood risk in the Painkalac Estuary
- inundation and erosion along Aireys Inlet and Fairhaven coastline
What we know
Flood risk in the Painkalac Estuary is influenced by:
- Rainfall from the surrounding catchment
- Ocean storm tides when the estuary mouth is open
The estuary mouth naturally opens and closes depending on:
- Rainfall
- Sand berm build-up
- Wave patterns.
This process can be slow or rapid, and the variability supports positive environmental outcomes.
Recent years have seen more unpredictable storms and rainfall, partly due to La Niña weather patterns. This has increased flood risk for:
- Homes
- Businesses
- Critical infrastructure near Painkalac Creek
When the sand berm is higher than nearby buildings, an artificial opening may be needed to prevent flooding.
Anticipated changes
New modelling shows increased risk. If a major flood occurs while the berm is closed, 106 properties could be affected, 54 more than previously estimated.
This projection is based on a 1% Annual Exceedance Probability (AEP) flood, meaning a flood with a 1 in 100 chance of occurring in any given year.
These additional properties are expected to be at risk by the year 2100.
What the reports say
The goal of this report was to find out how current and future climate changes might cause flooding along the open coast at Aireys Inlet and Fairhaven, and inside the Painkalac Creek Estuary.
Open Coast Findings
On the open coast, the steep dunes and cliffs keep ocean water from moving far inland. This means:
- We don’t expect waves or seawater to reach houses or roads directly.
- Sand dunes could slump or erode landward above the flood line.
- By 2100, with a 1.1 m rise in sea level, a few spots west of our study area may see minor inundation.
- A smaller sea level rise (0.8 m) might also flood areas near the Great Ocean Road.
Estuary Findings
We ran detailed water-flow (hydrodynamic) models for Painkalac Estuary under different climate and sea-level scenarios:
The highest flood risk happens when the sand berm at the creek mouth is closed and the catchment experiences a large flood. A closed berm blocks drainage, so water backs up into the estuary.
If the berm is open, creek water can flow out to sea more easily, reducing flood heights, even during big storm tides.
Catchment Hydrology
To understand how rainfall turns into creek flows, we:
- Analysed historic flood gauge data at the Painkalac Dam site.
- Calibrated our computer model against four past flood events.
- Followed national guidelines to estimate stream flows for key design storms.
- Included climate-change projections under a high-emission scenario (SSP5-8.5) for 2030, 2040, 2070, and 2100.
- Used those flow estimates in our flood models to map water levels, depths, and velocities across the catchment.
Key Takeaways
In a 1% annual-chance flood, about 106 private properties and 8 roads could be inundated.
Estuary water levels can rise as fast as (or even before) upstream creek gauges show increases.
Since Distillery Creek isn’t gauged, our flood warnings need to rely mainly on real-time and forecasted rainfall.
This information will help us plan better warnings, evacuation routes, and community preparedness for flooding events
This report shows how water flows through the Painkalac Creek area and how flooding might happen, so we can better prepare for future risks.
The goal is to understand how climate impacts flooding in the estuary and how erosion and flooding might affect the nearby coastline.
The report looks specifically at how water moves through the landscape of the Painkalac Creek catchment.
Flood risk considerations
To study flood risks, we used national guidelines and ran models to simulate how often floods might happen and how water behaves during those events.
We now have charts showing how water levels change over time during a flood. These were then used in a separate model that looks at how water moves across the land.
The catchment includes Painkalac Dam, built in 1978 to supply water to Aireys Inlet and Fairhaven. It holds about 532 million litres of water. Since 2016, those towns have been connected to Geelong’s water supply, so the dam is no longer used for drinking water.
Most of the catchment is forested, except for the floodplain and developed town areas.
Data use
To help with the flood analysis, the study also looked at data from nearby rivers, especially the Cumberland River at Lorne, which has similar water flow patterns. This helped extend the data used to understand how often floods might occur.
This report looks at how climate change could increase flooding in the estuary and cause more erosion along the coast.
Geology
The local geology affects how the sand moves or how the shoreline shifts. By studying these changes, we can better understand how risks like erosion or flooding might differ from place to place along the coast.
This part of the coast has a complex mix of soft sedimentary rocks and ancient volcanic features, which shape the beaches, cliffs, and estuaries, and influence how the land responds to erosion and coastal change.
Types of erosion
There are several types of erosion that affect the coastline in the study area, and how badly each area is affected depends on the shape of the land (like dunes and backshore) and the type of ground or rock underneath. The main types of erosion happening here include:
- Storm erosion: When big waves and high tides during storms wash away sand from the beach.
- Ongoing shoreline change: When the beach gradually shifts because more sand is being lost than gained, or the shoreline is adjusting to the direction of incoming waves.
- Long-term erosion from sea level rise: As sea levels rise, the shoreline slowly moves inland.
- Cliff erosion and instability: Coastal cliffs are wearing away or becoming unstable.
- Estuary barrier migration: Natural sand barriers at estuary mouths are shifting over time.
What you can do
- Learn more: Review the background information provided here.
- Attend the community session:
Aireys Inlet Community Hall
Friday 17 October
Drop in anytime between 3pm and 7pm
- Bring your questions: Especially if your property is now included in the impact area.
We understand this new modelling may be confronting. These findings are part of Council’s ongoing work to keep our community safe and reduce the impact of emergencies.
We want to keep community informed as we learn more.
What's next?
Planning for how we can reduce or adapt to these changes will begin in early 2026. You’ll have the opportunity to be involved in shaping those decisions.
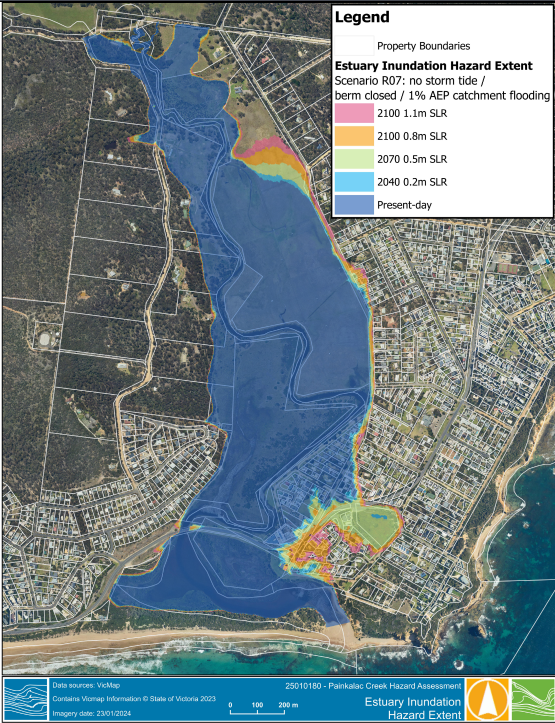
Scenario 7 shows the largest extent of potential flooding by the year 2100.
Map of Painkalac Estuary.